Search Console dashboard
draft · 2 image slots
The Search Console dashboard shows how a company's site performed in Google Search and how its pages tested in PageSpeed Insights. By the end, you will know where visibility came from, what earned clicks, and which pages deserve attention.
Read the search result totals
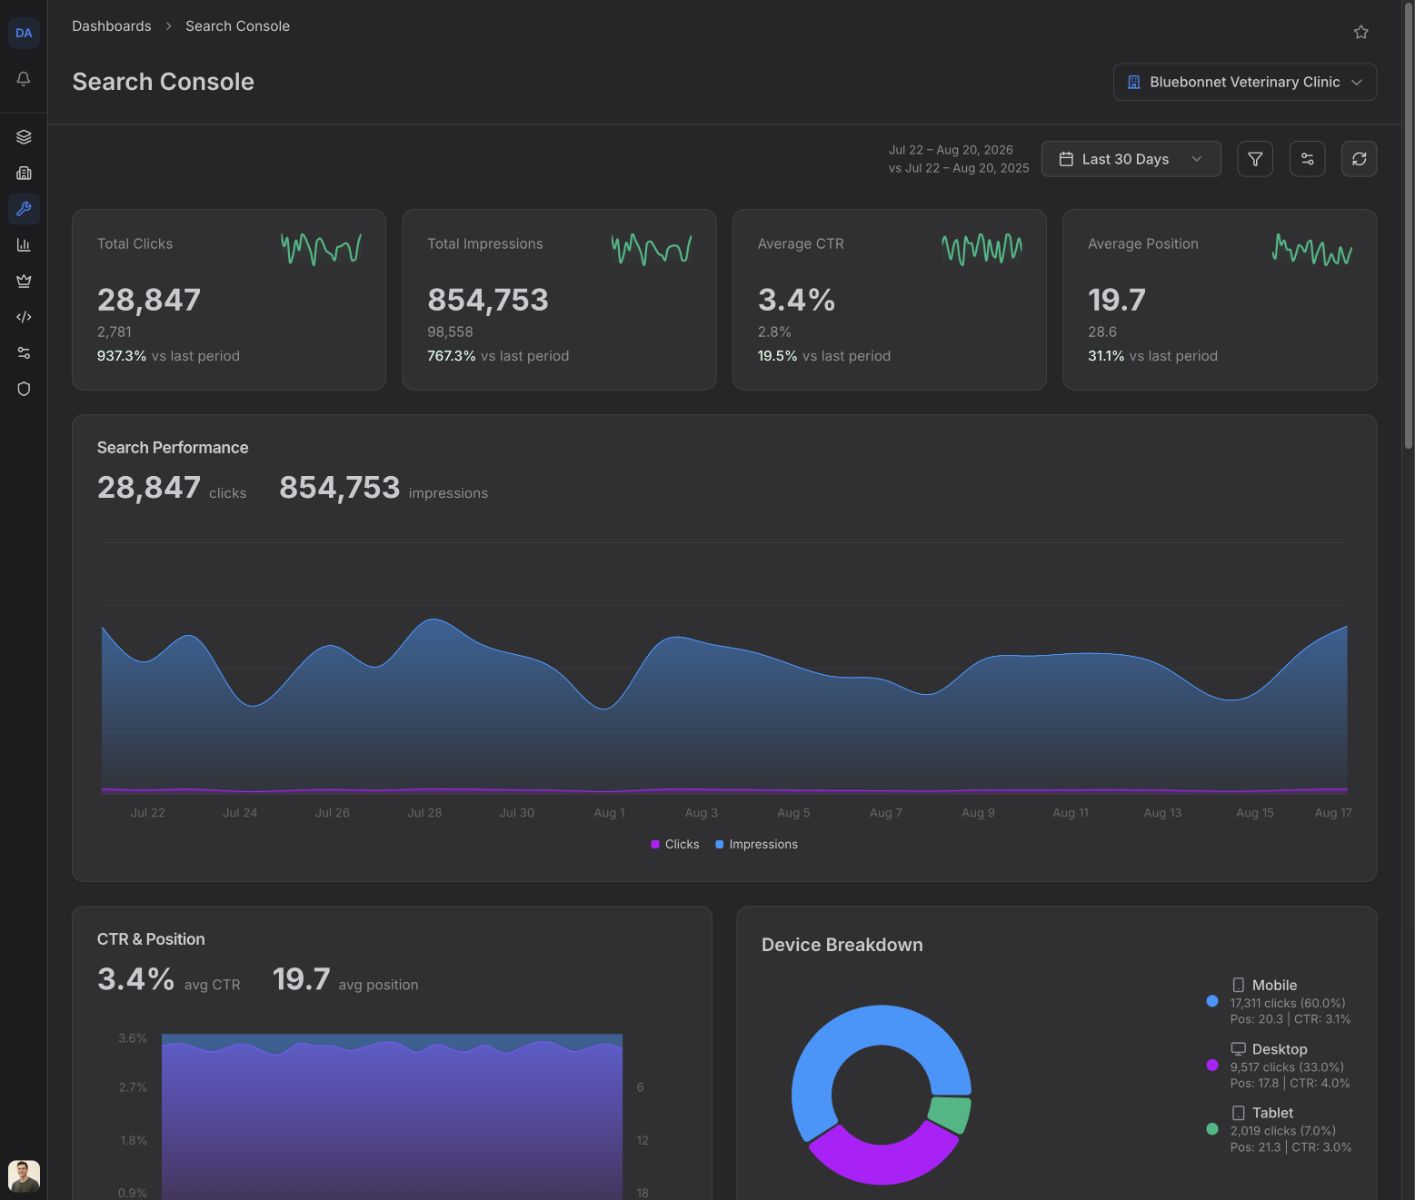
Open Dashboards → Search Console, choose the company, and set the reporting period. The first four cards are:
- Total Clicks — visits from Google Search results
- Total Impressions — times the site's result appeared in Google Search
- Average CTR — clicks divided by impressions
- Average Position — the site's average reported search position; lower is better
Turn on a comparison to place the earlier value under each headline metric and show its change.
Follow the trend
Search Performance plots clicks and impressions by date. Use it to see whether a total came from steady performance or a short spike.
CTR & Position plots the two rate-and-ranking measures together. Its large summary values are averages of the daily points in the chart, so they can differ slightly from the four headline cards, which calculate across the full reporting period.
The Filter sheet has no Search Console filters. Use the date control to change the reporting period.
Find the queries, pages, and devices behind the total
Device Breakdown divides clicks among Desktop, Mobile, and Tablet, then shows each device's click share, position, and CTR.
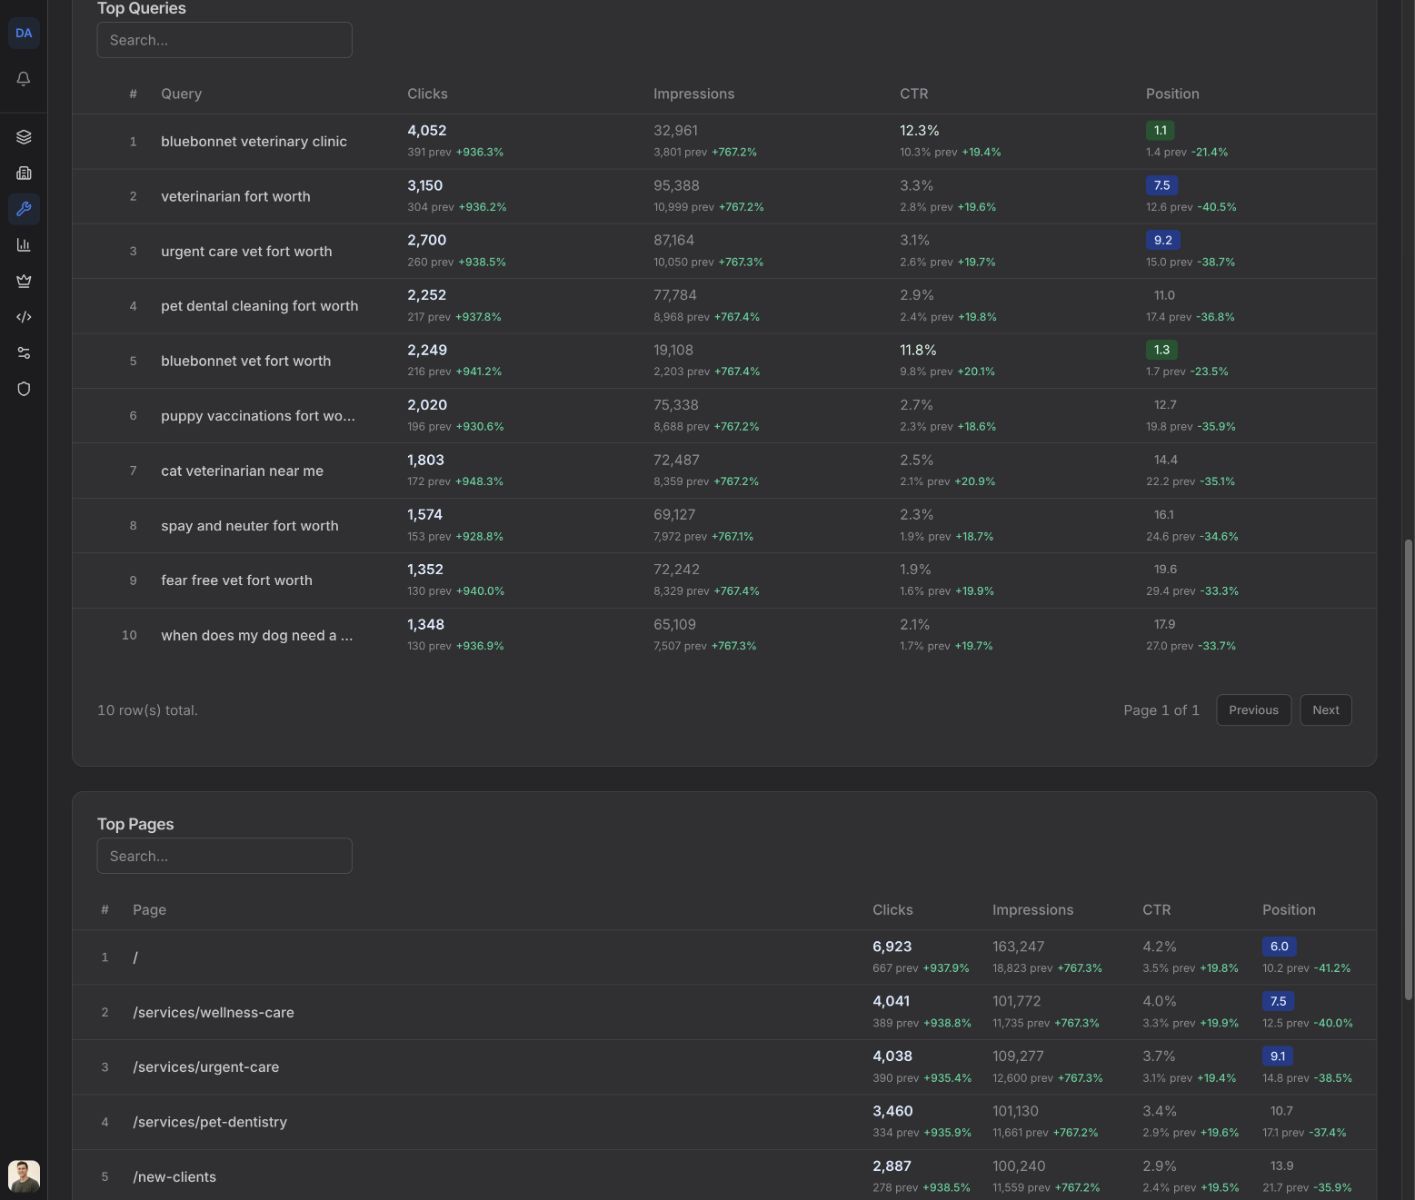
Top Queries lists the searches that produced the most clicks. Top Pages does the same for site pages. Both tables include Clicks, Impressions, CTR, and Position, and you can sort or search the rows when you need a specific result.
Check PageSpeed Insights
PageSpeed Insights tests the company's website for Mobile and Desktop. It loads a saved result when one exists and starts a test when no result has been saved. Results are cached for 30 days. Choose Run Test if no result is present, Check for Updates to check the saved result, or Force Refresh to run a fresh test when a cached result is shown.
The result contains four Lighthouse Scores — Performance, Accessibility, Best Practices, and SEO — plus LCP, FCP, TBT, and CLS under Core Web Vitals. Top Opportunities lists up to five of the lowest-scoring improvement areas returned by the test.
If the section says no website URL is configured, open the company record and go to Profile → Marketing → Website before running the test again.
Adjust the layout
Choose Customize Dashboard to show, hide, or reorder widgets for the selected company. If the page says All widgets are hidden, use the same control to restore a widget.