Reading your Overview dashboard
draft · 2 image slots
Overview turns several connected marketing channels into one journey. By the end, you will know what each stage includes, where the totals come from, and which questions the two breakdowns can answer.
Start with the right company and period
Open Dashboards → Overview, choose a company, and set the date range at the top. The dashboard uses the same date and comparison controls as Google Analytics and Search Console.
Overview can include data from Google Ads, Meta Ads, Google Search Console, Google Analytics, Google Business Profile, CallRail, and WPForms. Some of those channels do not have a separate dashboard in your workspace; their connected data can still contribute to Overview.
Read the journey from left to right
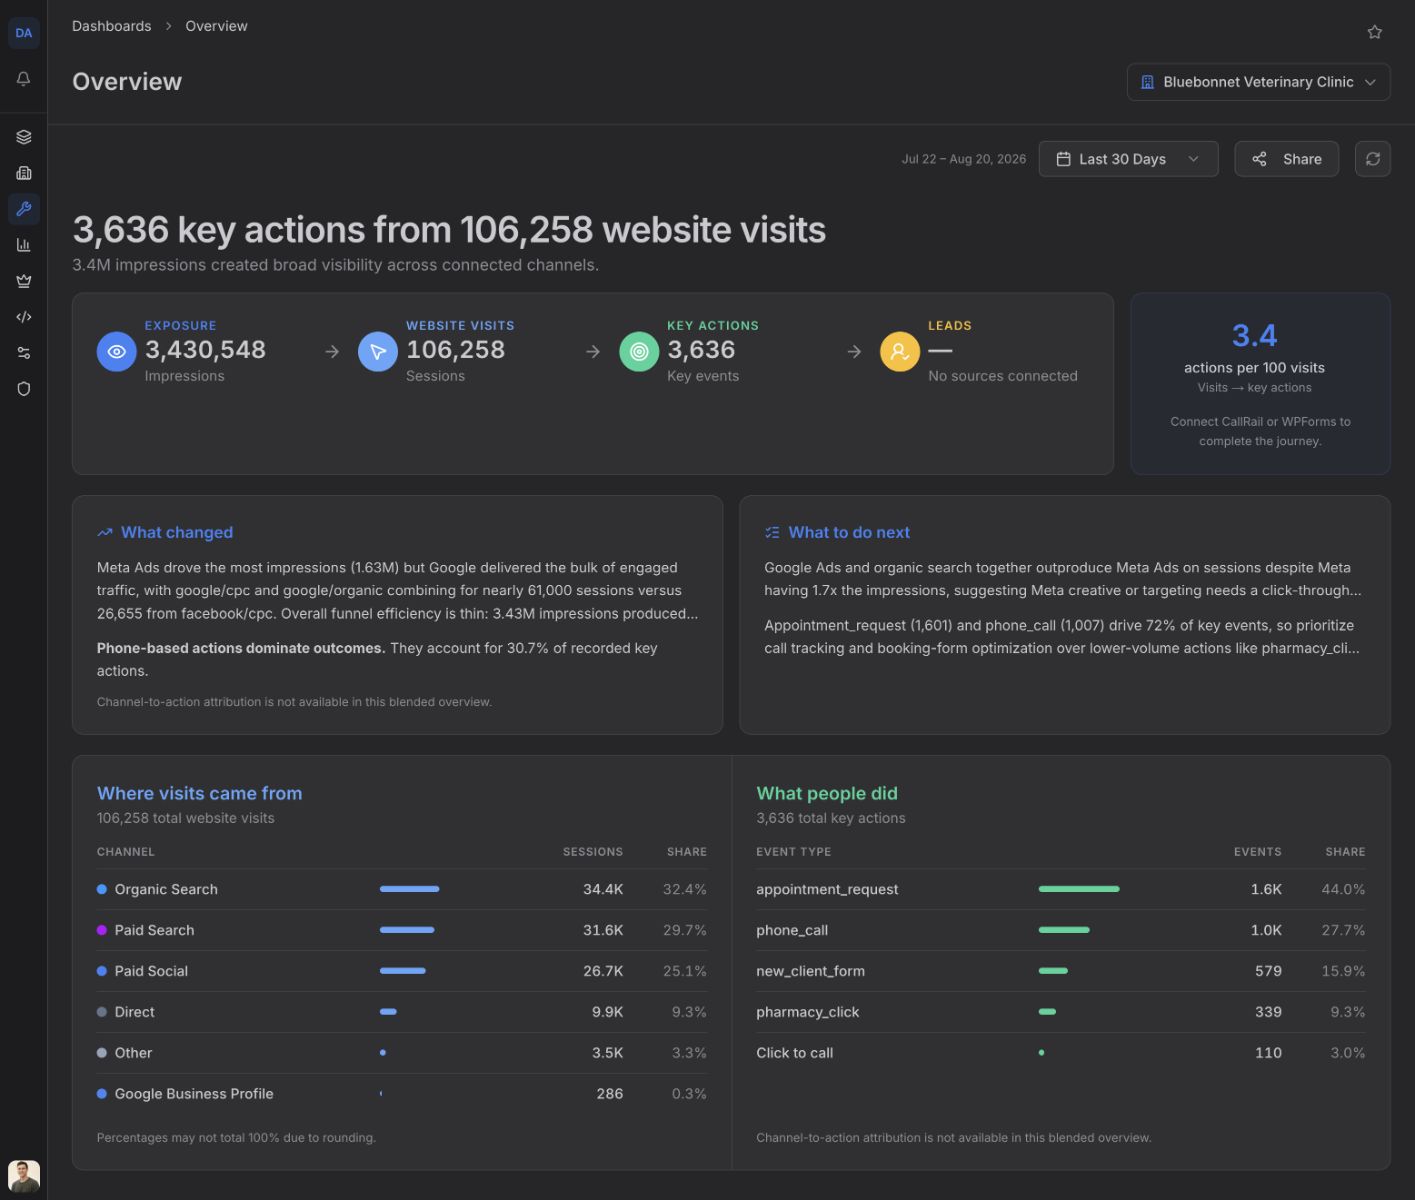
The large summary follows four possible stages:
- Exposure is the combined impressions from connected Google Ads, Meta Ads, Search Console, and Google Business Profile sources that reported impressions.
- Website visits combines Google Analytics sessions with Google Business Profile website clicks when that profile is connected.
- Key actions combines Google Analytics key events with Google Business Profile calls when that profile is connected.
- Leads appears when CallRail or WPForms is connected. It combines CallRail calls with completed WPForms submissions.
actions per 100 visits divides key actions by website visits, then multiplies the result by 100. It is a blended ratio, not a count of individual people moving through every stage.
Use the breakdowns to find the shape of the result
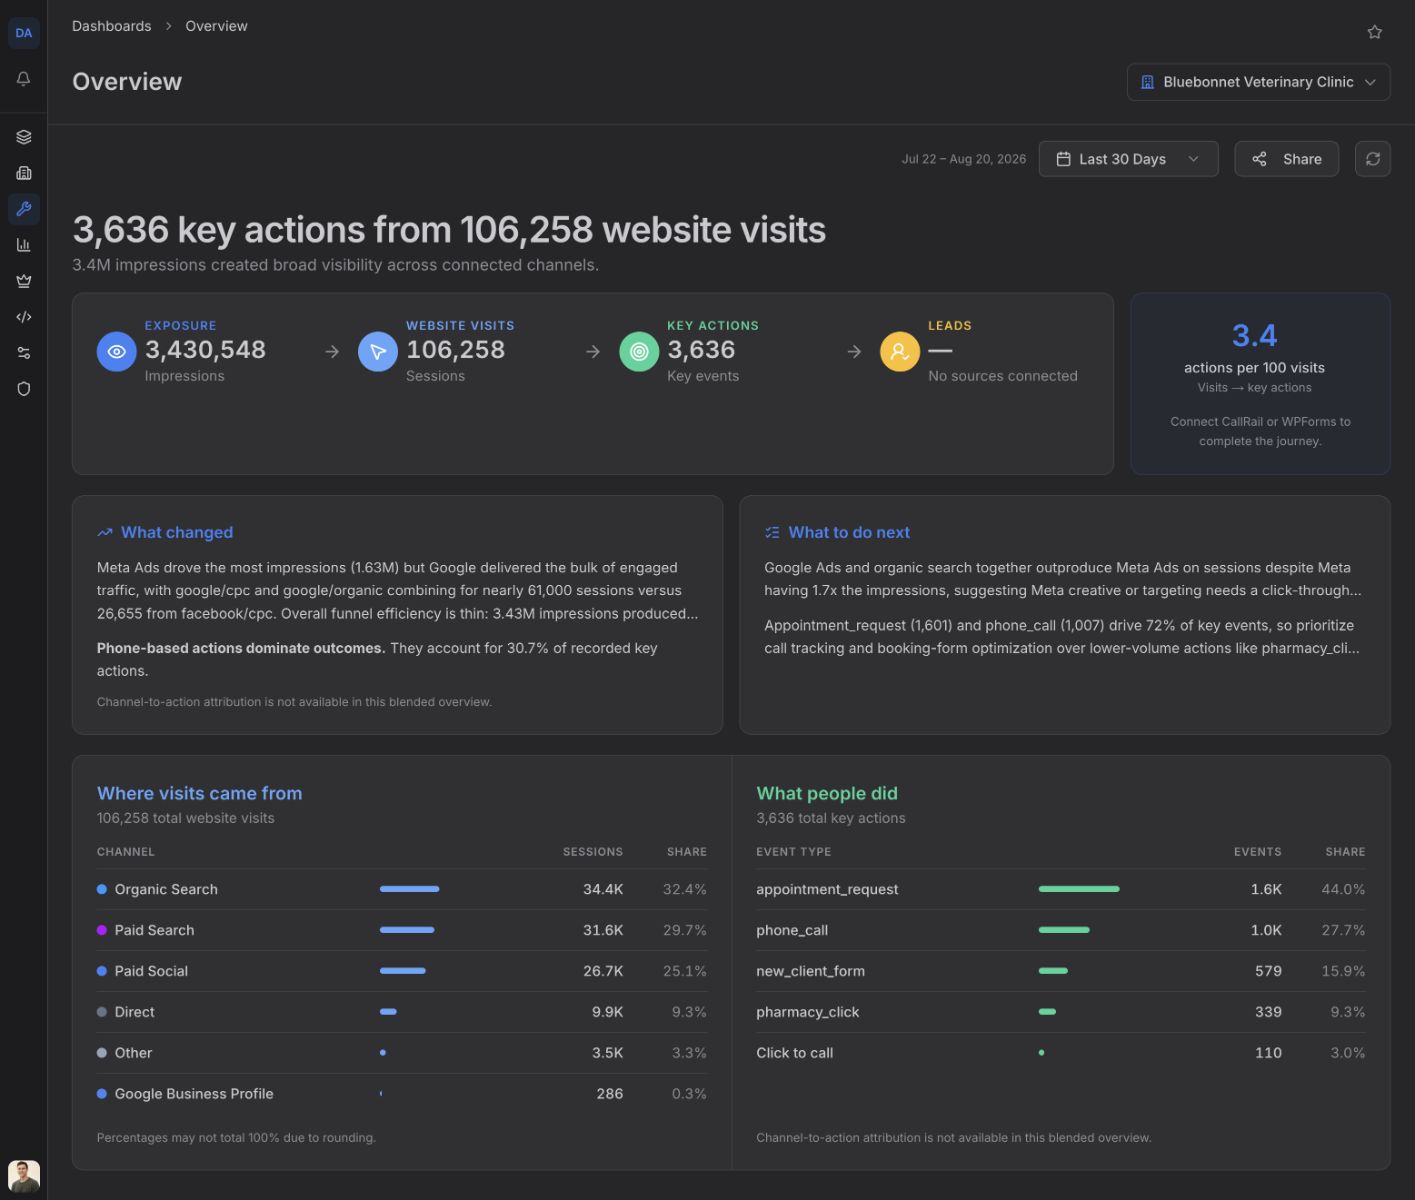
Where visits came from groups Google Analytics sessions into channels such as Paid Search, Paid Social, Organic Search, Direct, and Other. Google Business Profile website clicks appear as their own channel. The table shows up to six channels, their session counts, and their share of all website visits.
What people did ranks up to six key-event types by count and shows each event's share of total key actions.
These two lists are separate views of the journey. Overview does not assign each action back to a specific visit channel, so do not read the rows across as attribution.
Read change as a prompt, not a conclusion
Turn on a comparison to add changes beside the journey stages and breakdown rows. First check the two periods in the date control; then use the movement to decide where to look more closely.
When What changed and What to do next appear, they summarize the selected company's current pattern. Treat them as a starting point, then confirm the underlying totals and channel rows before acting.