Dashboard metric definitions
draft · 2 image slots
This glossary covers only the metrics on Overview, Google Analytics, and Search Console. By the end, you will know what each number counts and how Feta derives the ratios and blended totals.
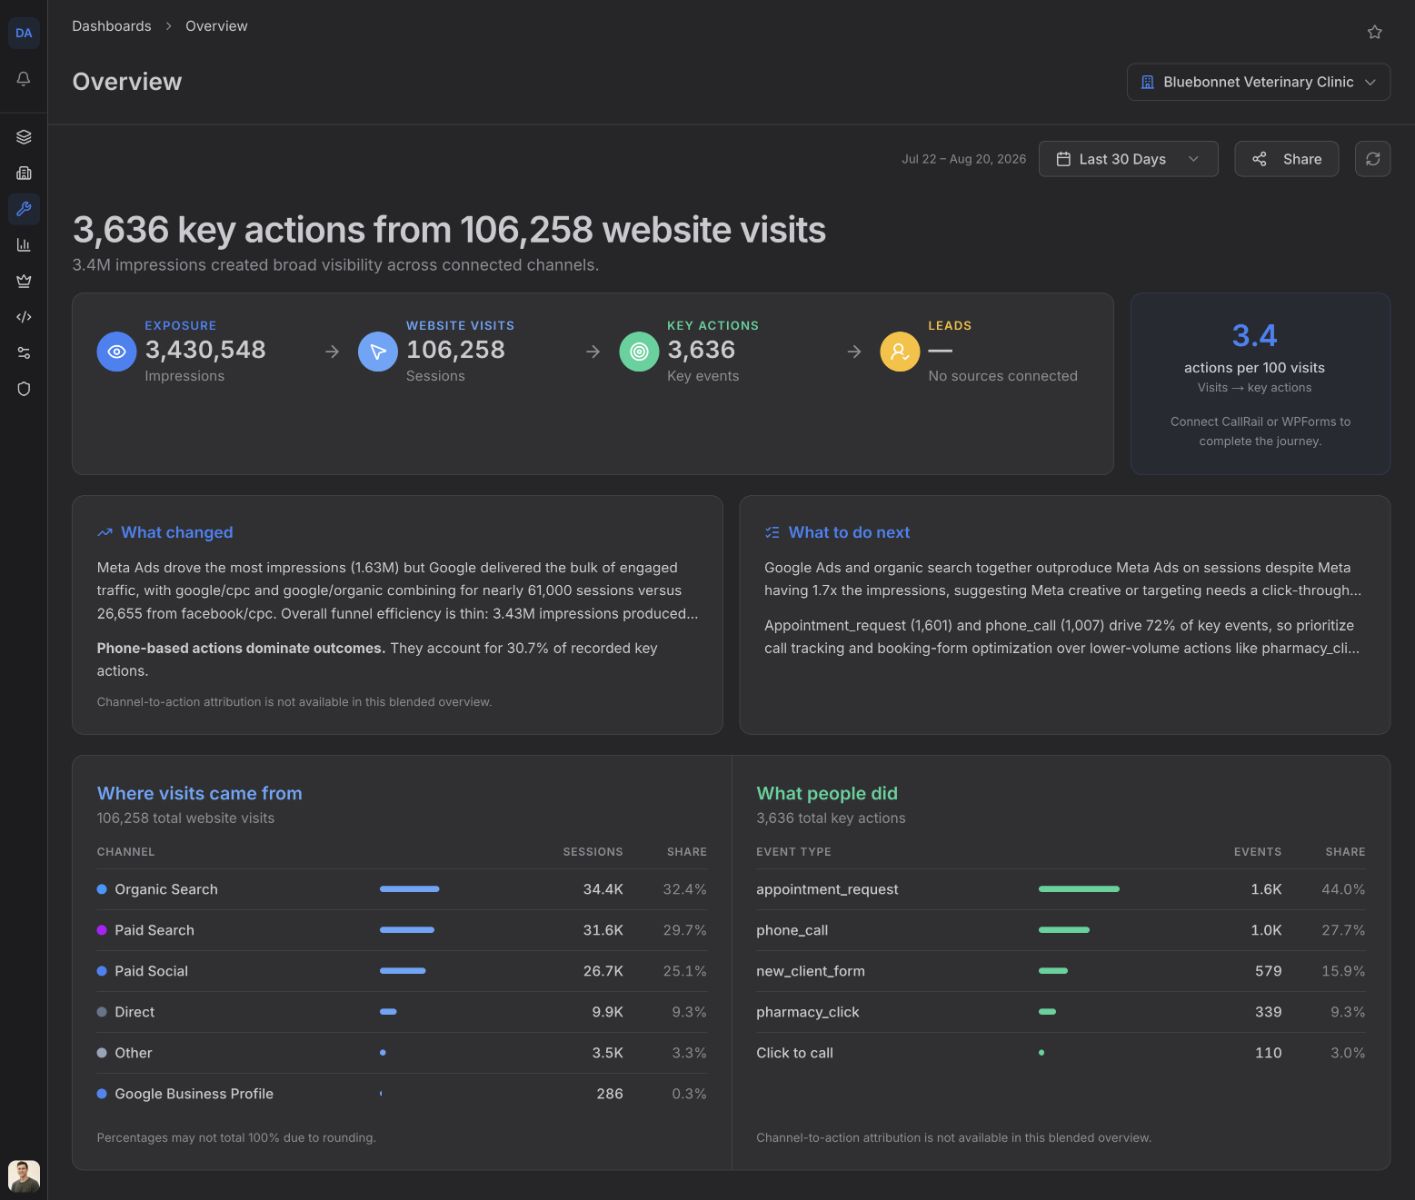
Overview
Exposure / Impressions is the sum of impressions reported by connected Google Ads, Meta Ads, Search Console, and Google Business Profile sources. A connected source with no impressions in the current or comparison period is left out of the source list.
Website visits / Sessions is Google Analytics sessions plus Google Business Profile website clicks when that profile is connected.
Key actions / Key events is the count of Google Analytics key events plus Google Business Profile calls when that profile is connected.
Leads is CallRail calls plus completed WPForms submissions. The stage appears only when at least one of those lead sources is connected.
actions per 100 visits is:
key actions ÷ website visits × 100
Share in Where visits came from is a channel's sessions divided by all website visits. Share in What people did is an event type's count divided by all key actions.
Google Analytics
Sessions is the number of visits reported by Google Analytics in the selected period.
Users is the number of unique users Google Analytics reports for the selected period.
Visitors in Traffic Overview adds the visitor count from each daily point. The same person can therefore contribute on more than one day, so this chart total can be higher than Users.
Pageviews is the total number of page views. Repeat views count again.
Key Events is the sum of events configured as key events in Google Analytics.
Engaged Sessions is the session count Google Analytics reports as engaged. The percentage in Sessions & Engagement is engaged sessions divided by sessions.
Session Rate in Conversion Funnel is:
sessions ÷ pageviews × 100
Conversion Rate in Conversion Funnel is:
key events ÷ sessions × 100
Traffic Sources groups by source and medium, totals users in each group, keeps the eight largest groups, and calculates each share against users across those displayed groups.
Devices groups users by device category. Each share is that category's users divided by users across all displayed device categories.
Key Events ranks the five largest event types. Each share is the event count divided by the total across those five displayed types.
Top Cities shows users and sessions by city, ordered by users. Top Pages shows pageviews and users by page, ordered by pageviews.
Search Console
Total Clicks is the number of clicks from Google Search results.
Total Impressions is the number of times a result from the site appeared in Google Search.
Average CTR is:
total clicks ÷ total impressions × 100
Average Position carries Google's reported position value. When Feta combines rows, it weights position by impressions. Lower values are better.
Search Performance totals clicks and impressions from the daily rows and plots both by date.
CTR & Position plots daily CTR and daily position. The two large values above this chart are simple averages of its daily points; they are not the same calculation as the full-period headline cards.
Device Breakdown uses clicks for the chart and share. Device CTR is clicks divided by impressions, and device position is weighted by impressions when rows are combined.
Top Queries and Top Pages show the same four search metrics for each query or page: Clicks, Impressions, CTR, and Position.
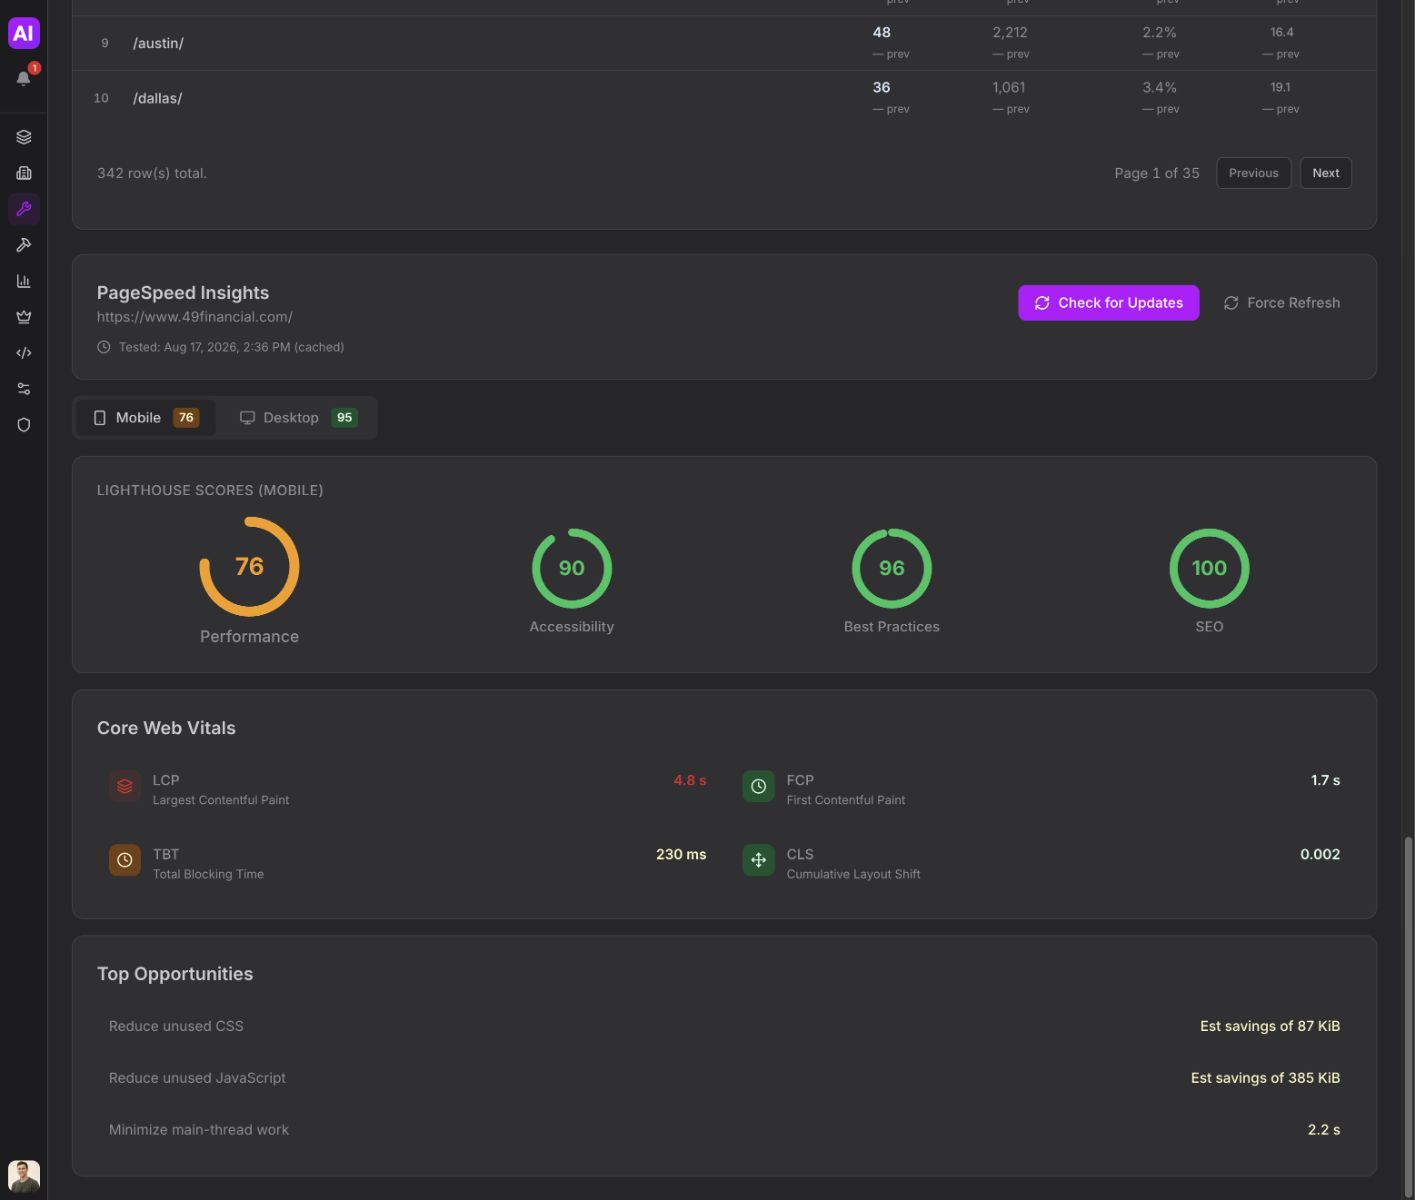
PageSpeed Insights
Performance, Accessibility, Best Practices, and SEO are Google Lighthouse category scores converted to a 0–100 scale.
LCP is Largest Contentful Paint. FCP is First Contentful Paint. TBT is Total Blocking Time. CLS is Cumulative Layout Shift. Feta displays the values returned by Google PageSpeed Insights for the selected Mobile or Desktop test.